Server analysis of #mcstats
This is a follow-up to the series of analyses of the mcstats data. Click here to read the previous post. Most graphs uses 2,300,000 data points (100,000 from each hour).
Average millisecond per tick distribution
This post will focus on the server side, specifically speed. Let's start off by graphing the distribution of average tick milliseconds

What's great about this distribution is that the great majority are below 50 ms, which actully isn't too bad.
Server mod popularity

CraftBukkit is certanly the most popular, but is it also the fastest and most memory efficient? Let's start with memory efficiency. To figure out, we're going to compare the three most popular server types by their memory usage.
Memory (RAM) efficiency
The percent active ram used by a given player is calculated as:
(1 - memory free / memory total) / players online

Maybe not so surprising. What you get in flexibility of mods, you pay out in memory usage. CraftBukkit is still the winner if you're going with mods however.
Average milliseconds per tick
What about raw speed, and does it matter if you run headless or GUI supported? Let's just focus on the two most popular mods.

Memory usage isn't really affected, but average millisecond per tick is, though not by much. About 10ms for CraftBukkit, which wins the title of most memory efficient and fastest server mod.
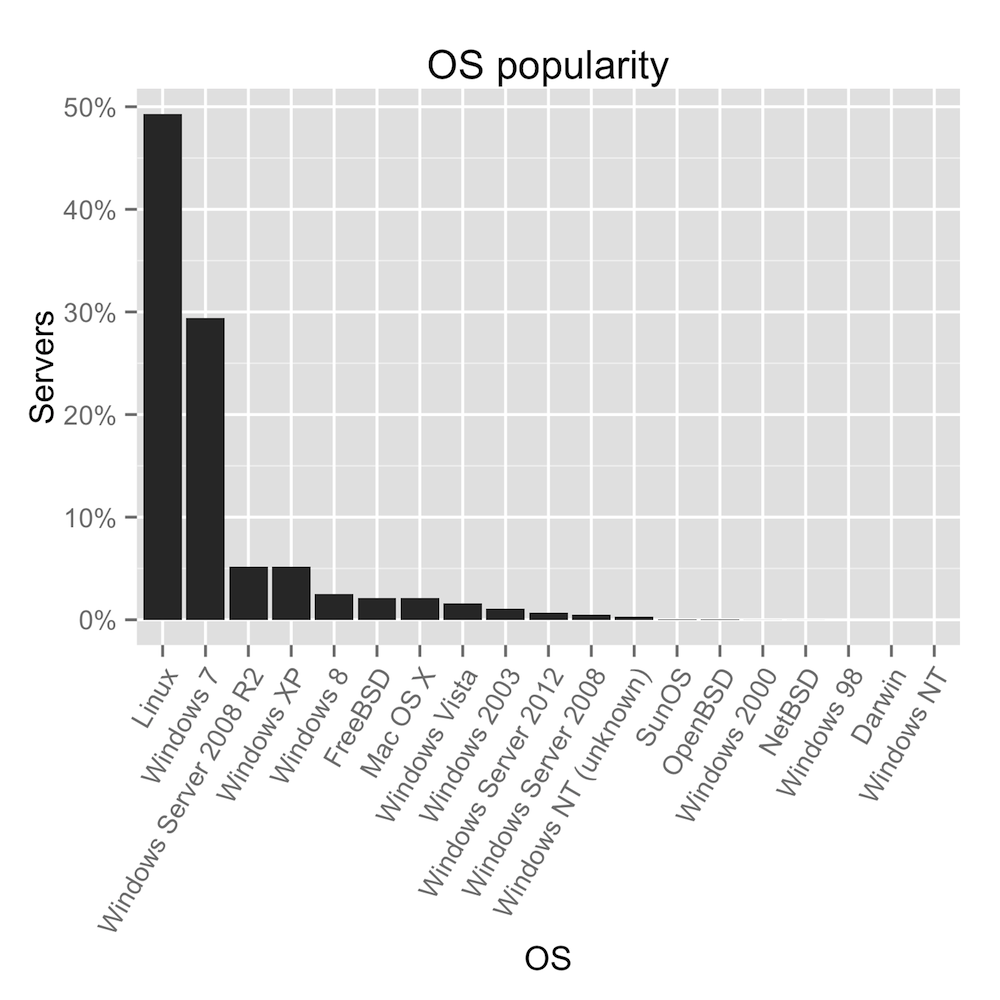
Fastest OS
Does the OS you choose affect the performance of your minecraft server?

This time the difference between the most efficient and most inefficient is pretty dramatic. Linux, which is also the most popular server OS, has an average tick millisecond more than twice of the worst offender, Windows 2003.
Fastest version of Linux
Let's zoom in even further, and analyze which version of Linux is most efficient.

You should definitely take this last graph with a grain of salt, since only about 200 servers using 2.6.32-279.el6.x86_64 was analyzed, which probably isn't enough to be statistically significant.
If you have any comments or questions about the graphs, you should contact me on twitter @DanielRapp.
If you think I've done something wrong, you can check out the code used to produce the graphs on GitHub.